Information & Reports
In my current job I am often assigned special projects. I enjoy the variety and the challenge. Sometimes this includes translating peer-reviewed research publications into more widely accessible stories. Other times it might be compiling information about faculty projects and presenting it in a concise, visual format.
The role of a communicator is not so much to create content, but curate and display content in new, creative ways, tailored to a particular audience.
Infographic research translation
For this research translation, I condensed a peer-reviewed, 16-page journal article on opioid overdoses in rural areas, authored by Dr. Rebecca Headly Konkel and Dr. Chyrstina Hoffman, and published in Deviant Behavior.
I used icons from the Noun Project and the chart tool in Adobe Illustrator, and created the final version, at right, in Adobe InDesign.

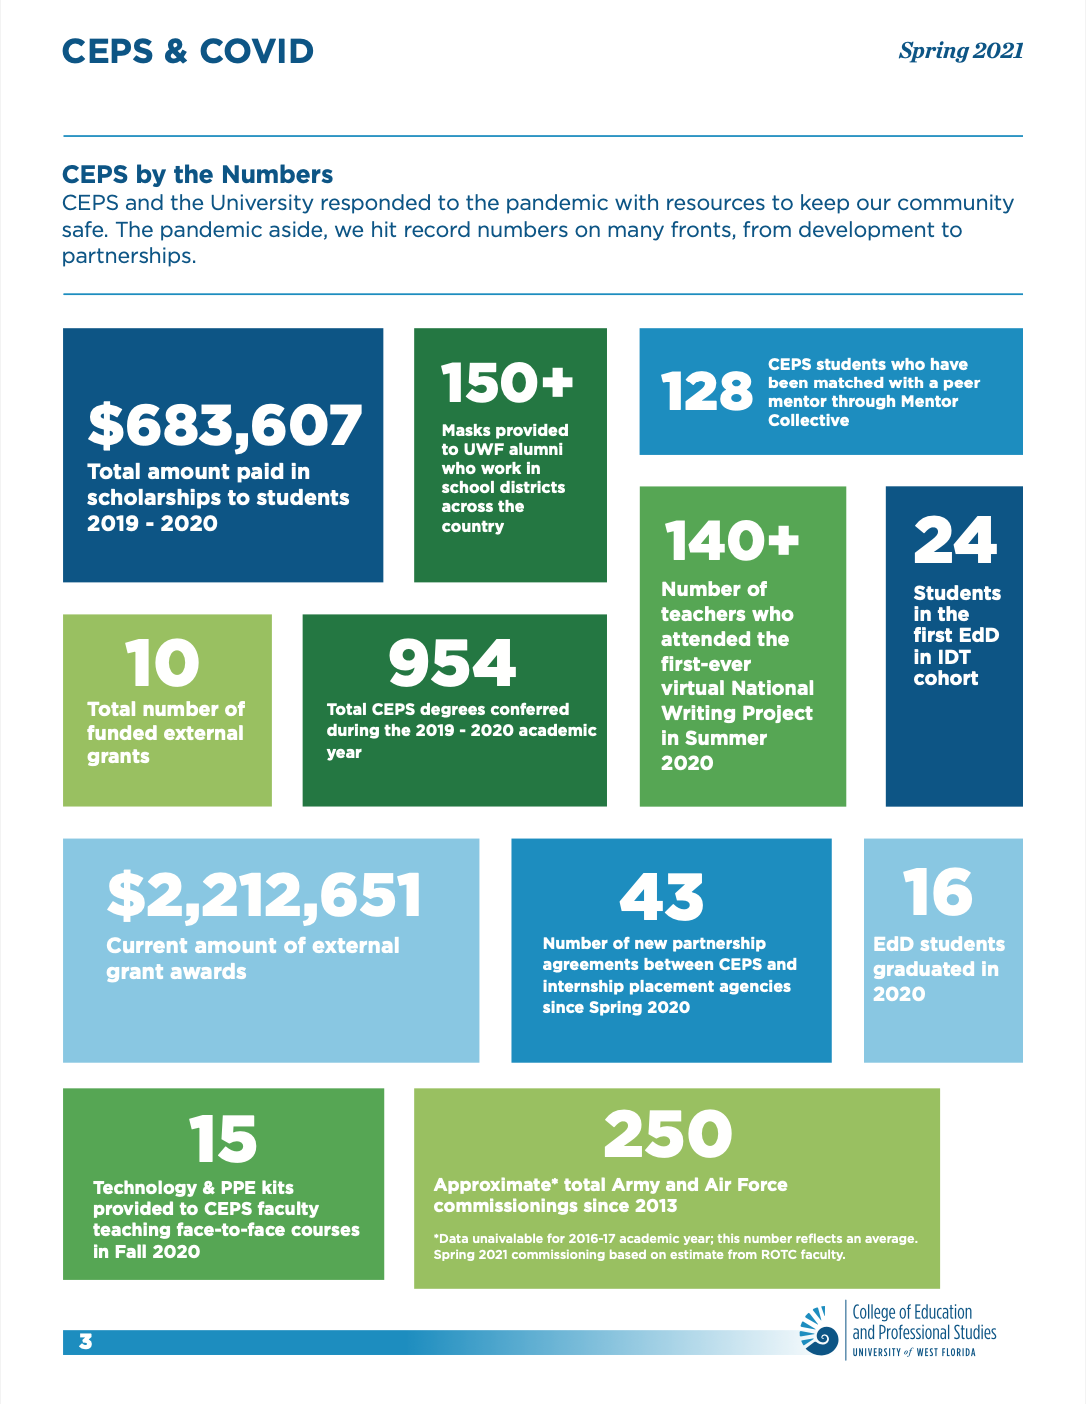
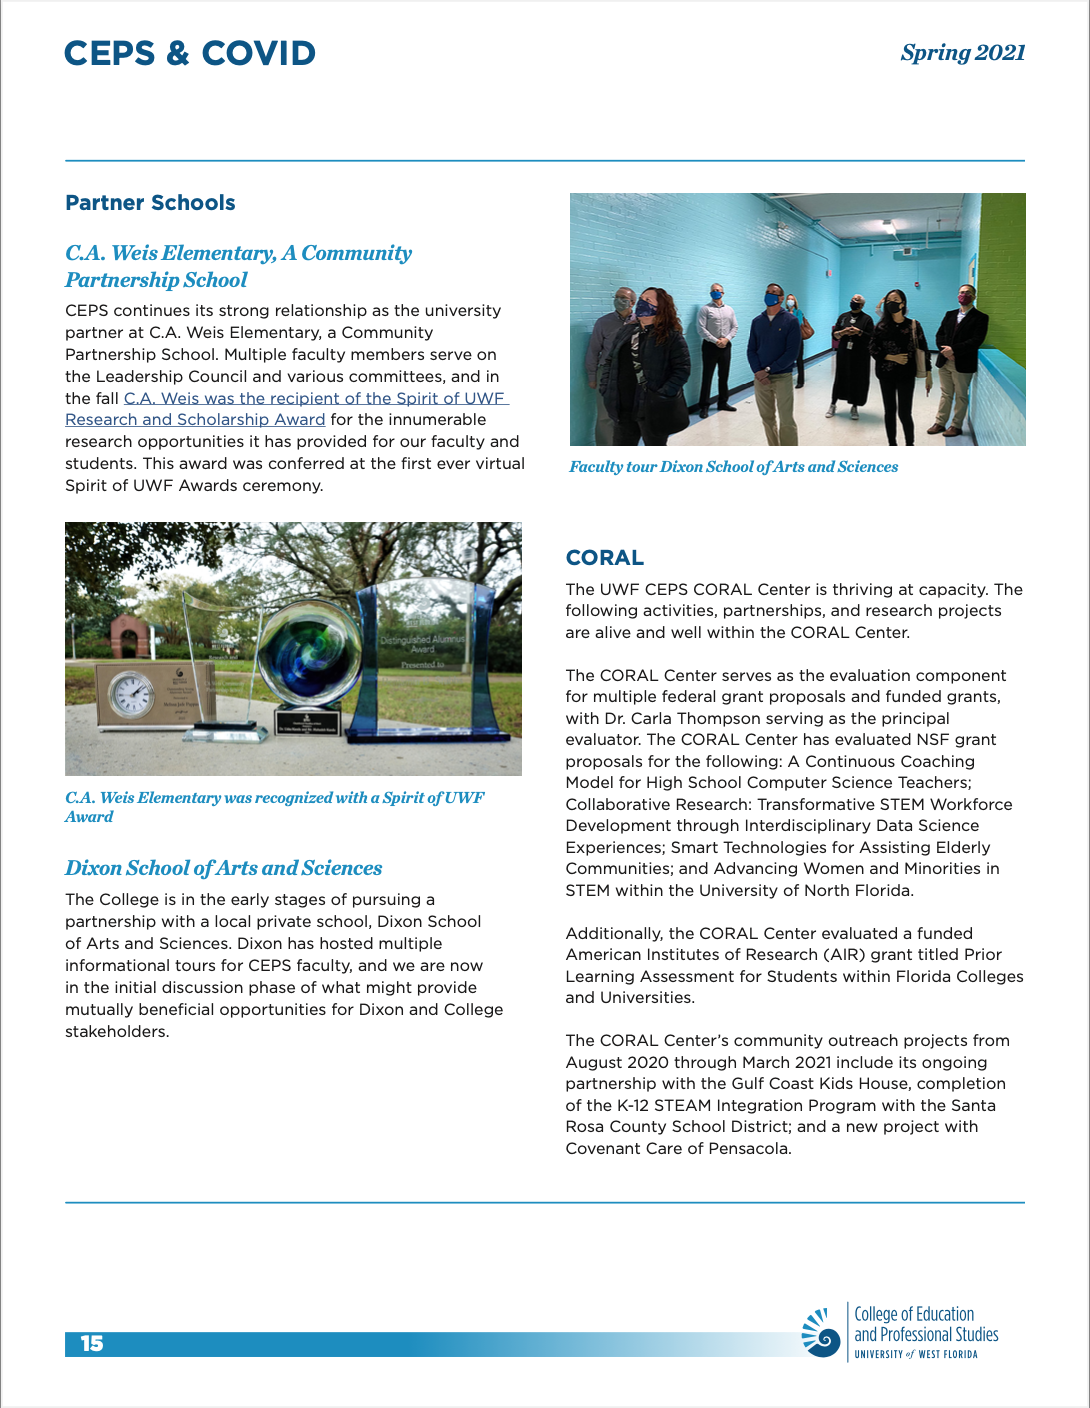
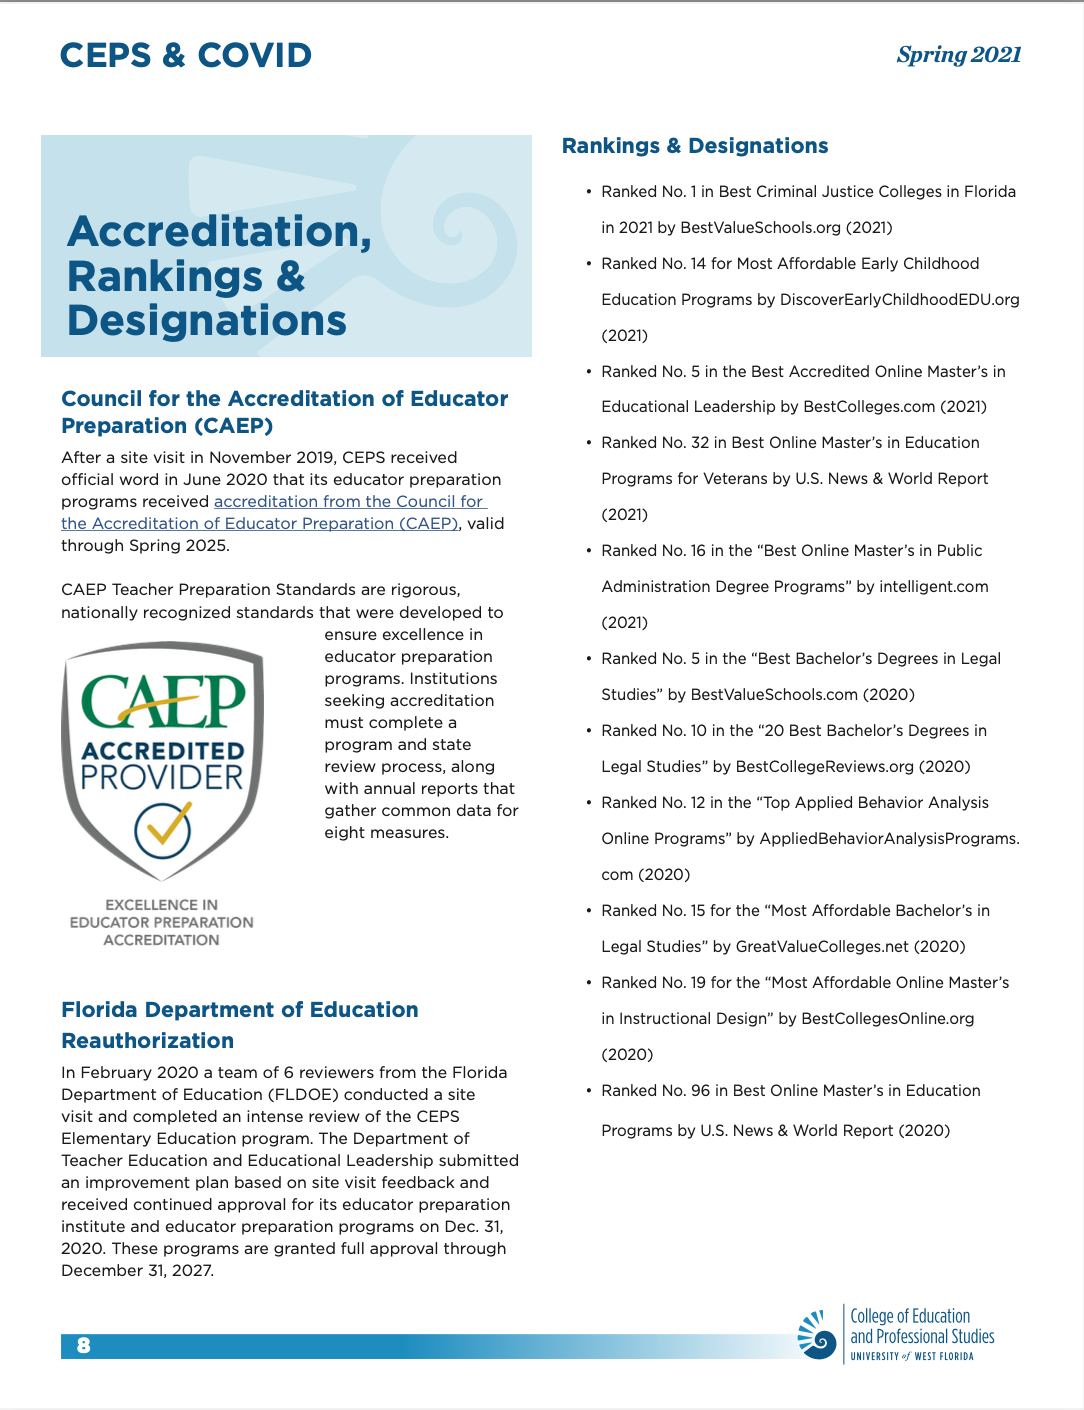
Internal report
At the one-year mark of the COVID-19 pandemic, we wanted to celebrate the accomplishments of our college, faculty and staff, and share it as a means to loop everyone in on our collective accomplishments despite our remote modality.
I gathered the stories and visuals, drafted the copy and created the final report in Adobe InDesign.